Optimiser les parcours clients de manière proactive
Genesys Cloud offre un ensemble étendu de fonctionnalités que vous pouvez utiliser pour obtenir des informations sur les parcours de vos clients. Ces outils vous aident dans les domaines suivants :
- Vous permet d'obtenir une vue globale et multicanal de vos parcours clients.
- Permet de suivre, d'analyser et d'optimiser chaque étape de l'expérience client.
- Fournit des visualisations dynamiques et des cartes thermiques qui révèlent les niveaux d'engagement des clients à travers les composants du flux architectural.
- Permet d'obtenir des informations immédiates sur les zones les plus fréquentées et les interactions.
Avec des vues granulaires et de haut niveau, vous pouvez utiliser Flow Insights, Journey Flows et Replay Mode pour vous plonger dans des composants spécifiques du flux Architect et effectuer les opérations suivantes :
- Mesurer la performance du flux.
- Contrôler la fréquence des étapes clés du flux.
- Comprendre comment les clients progressent vers les résultats souhaités en matière de flux.
- Visualiser les chemins empruntés par les clients, en indiquant les réussites et les difficultés.
Utilisez la gestion des parcours pour étendre votre vision au-delà des flux d'architectes à canal unique, grâce à 365 jours de données cross-canal, et procédez comme suit :
- Effectuer une analyse des tendances et des entonnoirs.
- Suivre les performances du voyage au fil du temps.
- Identifiez rapidement les changements dans les mesures de votre parcours.
- Identifier les points de friction dans les transitions multicanal.
- Améliorer l'expérience des clients.
- Améliorer la satisfaction des clients sur tous les points de contact.
Obtenez des informations puissantes sur vos parcours clients avec Flow Insights:
Les principaux avantages en un coup d'œil
Détail des principaux cas d'utilisation
Concentration sur les composants critiques du flux architectural avec un nombre élevé d'interactions
Des informations exploitables
- Sur la page d'accueil Architect, cliquez ou survolez le menu Flows et sélectionnez le type de flux souhaité.
- Cliquez sur le flux que vous souhaitez analyser.
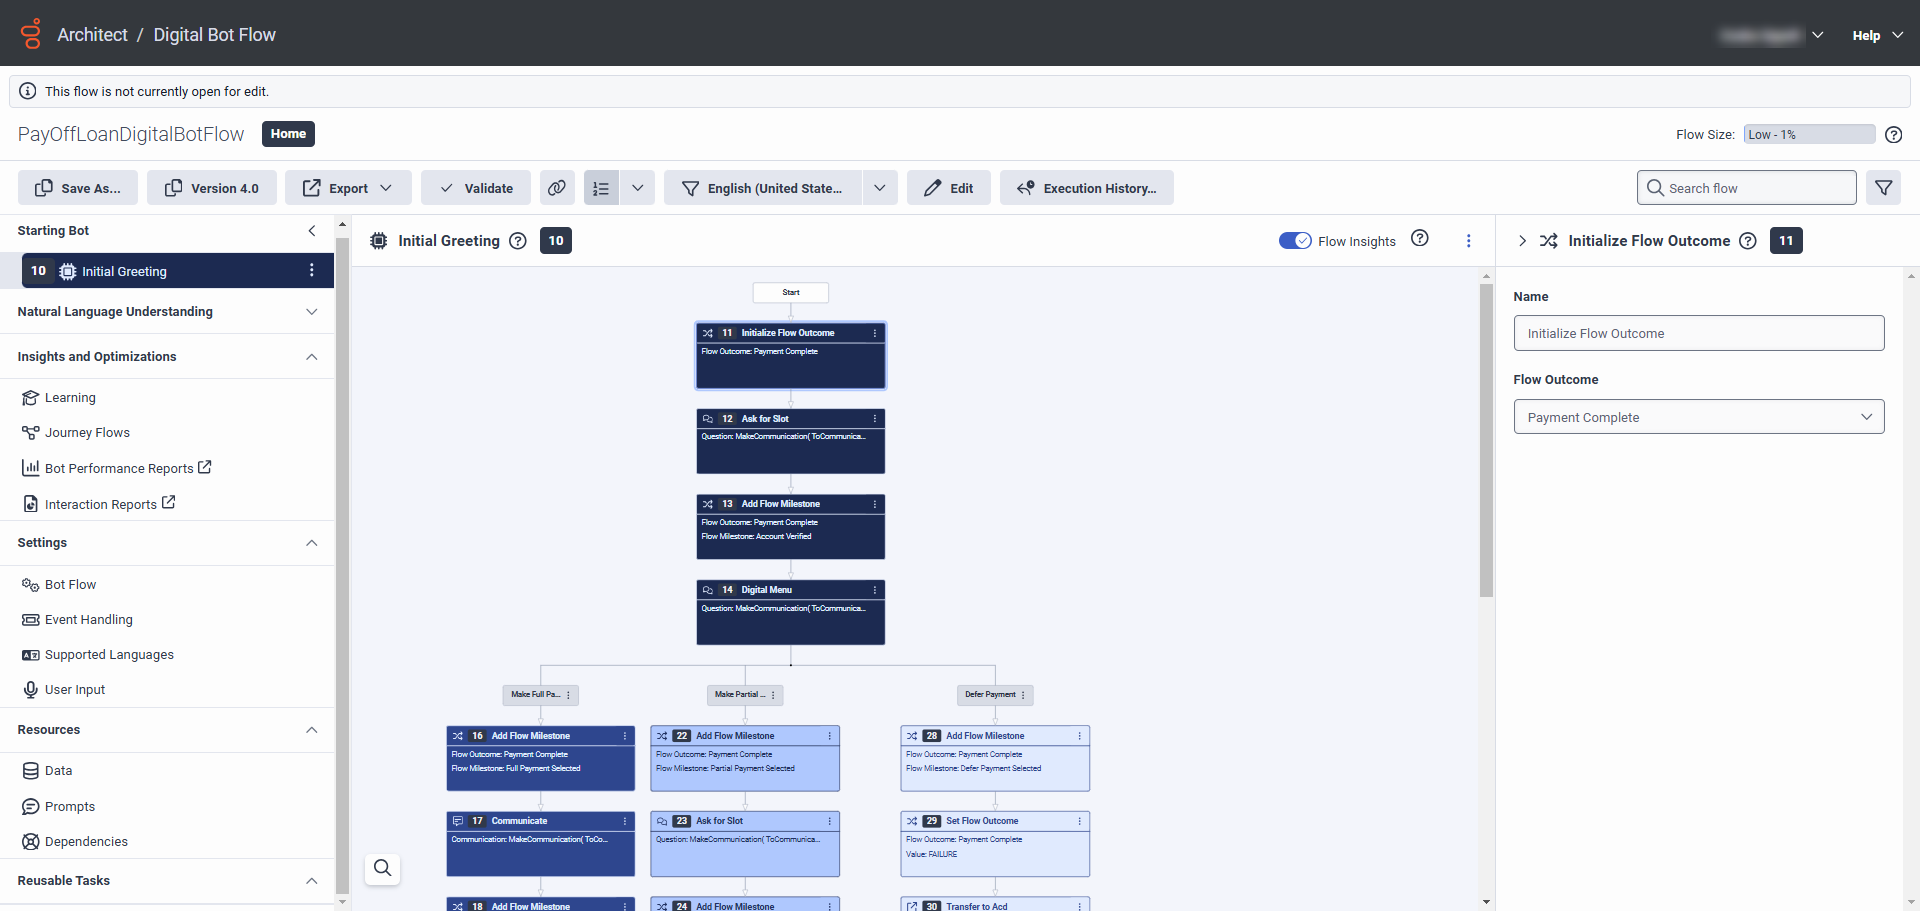
- Utilisez le bouton Flow Insights pour afficher la carte thermique d'interaction pour le flux. Note: Pour que la carte thermique apparaisse, il faut que des données d'interaction aient été recueillies au cours des sept derniers jours.
- Recherchez les éléments du flux dont les niveaux de fréquence (nombre d'interactions) sont élevés et vérifiez si les clients s'éloignent des étapes suivantes. Dans l'exemple suivant, les clients arrivent jusqu'à l'action du menu numérique dans un flux de robots numériques, mais ne parviennent pas à aller plus loin :
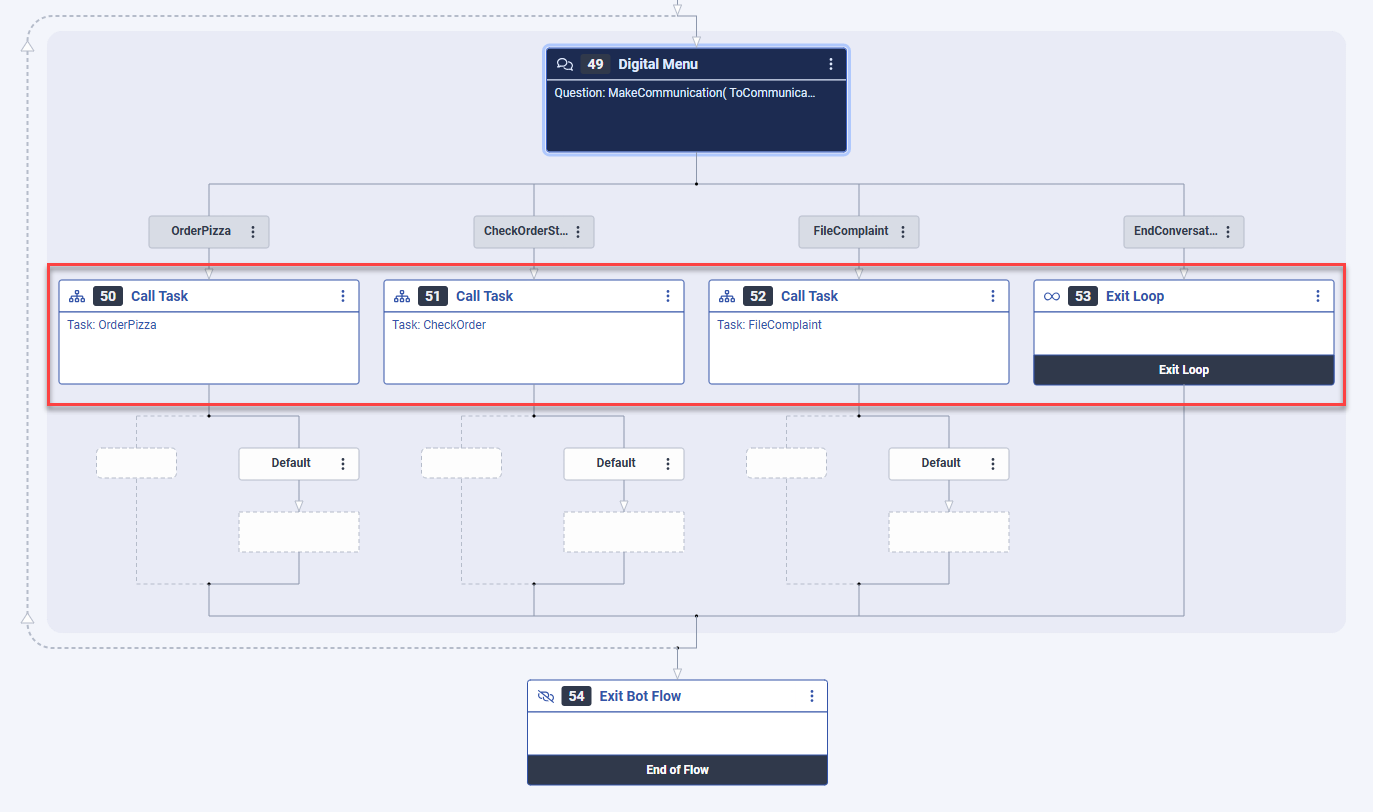
- Examinez maintenant l'action du menu numérique afin de déterminer pourquoi les progrès sont bloqués et d'identifier les actions nécessaires pour supprimer les points de friction.
Obtenez des informations puissantes sur vos parcours clients avec Journey Flows:
Les principaux avantages en un coup d'œil
Détail des principaux cas d'utilisation
Des informations exploitables
Supposez que vous êtes un administrateur ou un analyste de centre de contact qui souhaite évaluer l'efficacité d'un robot. Votre objectif est de comparer le nombre de clients qui parviennent à une résolution grâce au robot par rapport à un agent humain (ACD). Pour accomplir cette tâche, utilisez les fonctionnalités de Journey Flows.
- Sur la page d'accueil Architect, cliquez ou survolez le menu Flows et sélectionnez le type de flux souhaité.
- Cliquez sur le flux que vous souhaitez analyser.
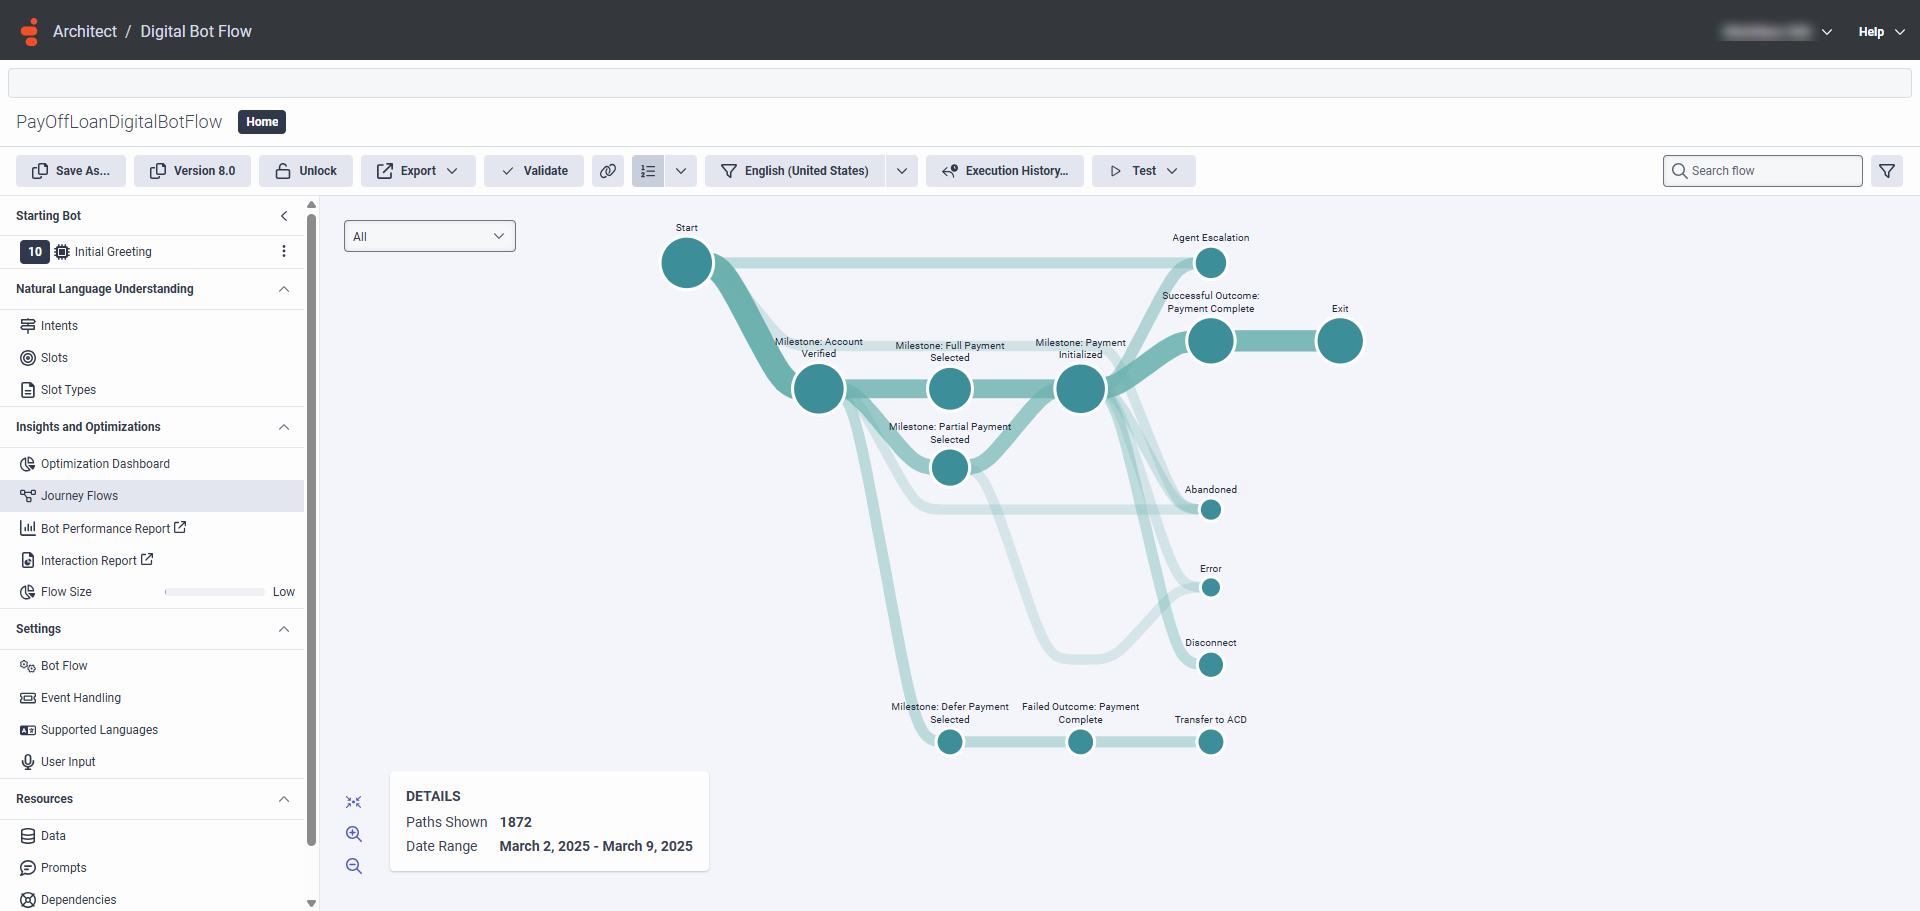
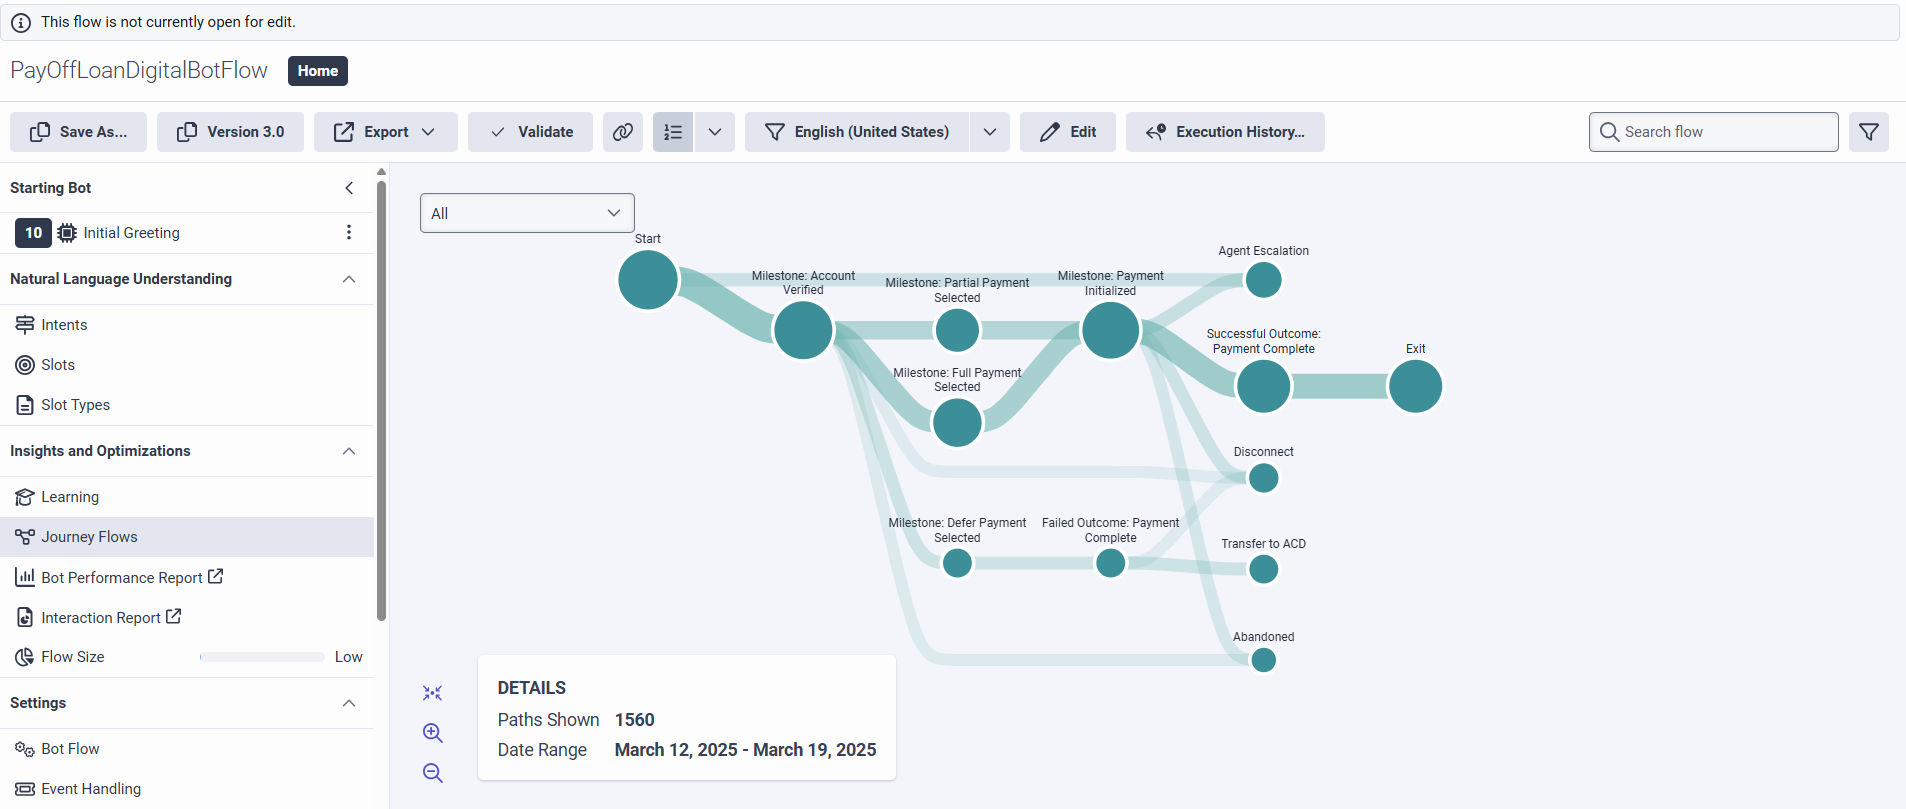
- Cliquez sur Journey Flows dans le menu Insights and Optimizations. La visualisation Journey Flows s'ouvre. La visualisation montre la répartition des clients en fonction des différentes étapes et résultats du flux, ainsi que les différentes raisons de sortie du flux. La visualisation montre également comment le parcours du client s'est déroulé à chaque étape du flux :
- Ensuite, parce que vous voulez savoir combien de clients sont allés au jalon Payment Initialized , survolez le jalon pour afficher le compte de fréquence :
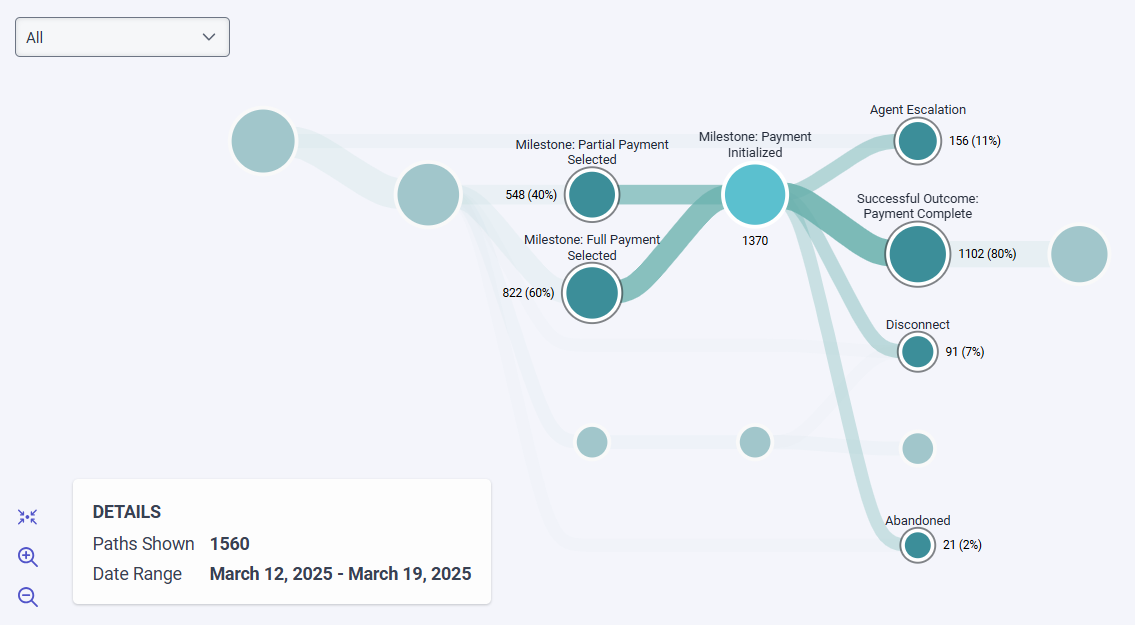
- Maintenant, pour savoir pourquoi 11 % des clients qui ont franchi l'étape Paiement initialisé ont demandé à parler à un agent humain et pourquoi 7 % des clients se sont déconnectés, utilisez Flow Insights pour générer une carte thermique des options du menu numérique dans votre menu Paramètres initiaux ou utilisez Replay Mode pour vérifier les instances d'exécution de votre flux.
- Examinez ensuite les sessions qui ont été Abandonnées.
Obtenez des informations puissantes sur vos parcours clients avec Replay Mode:
Les principaux avantages en un coup d'œil
Détail des principaux cas d'utilisation
Des informations exploitables
- Sur la page d'accueil d'Architect, cliquez ou survolez le menu Flows et sélectionnez un type de flux pour lequel des données d'exécution historiques sont disponibles.
- Ouvrez le flux que vous avez exécuté précédemment pour le débogage et le dépannage.
- Cliquez sur Historique des exécutions. La boîte de dialogue Historique de l'exécution du flux s'ouvre.
- Sous Results, Architect répertorie les instances d'exécution précédentes du flux que vous avez ouvert et fournit le nom, la version, le type de flux ainsi que les dates de début et de fin des instances de flux.
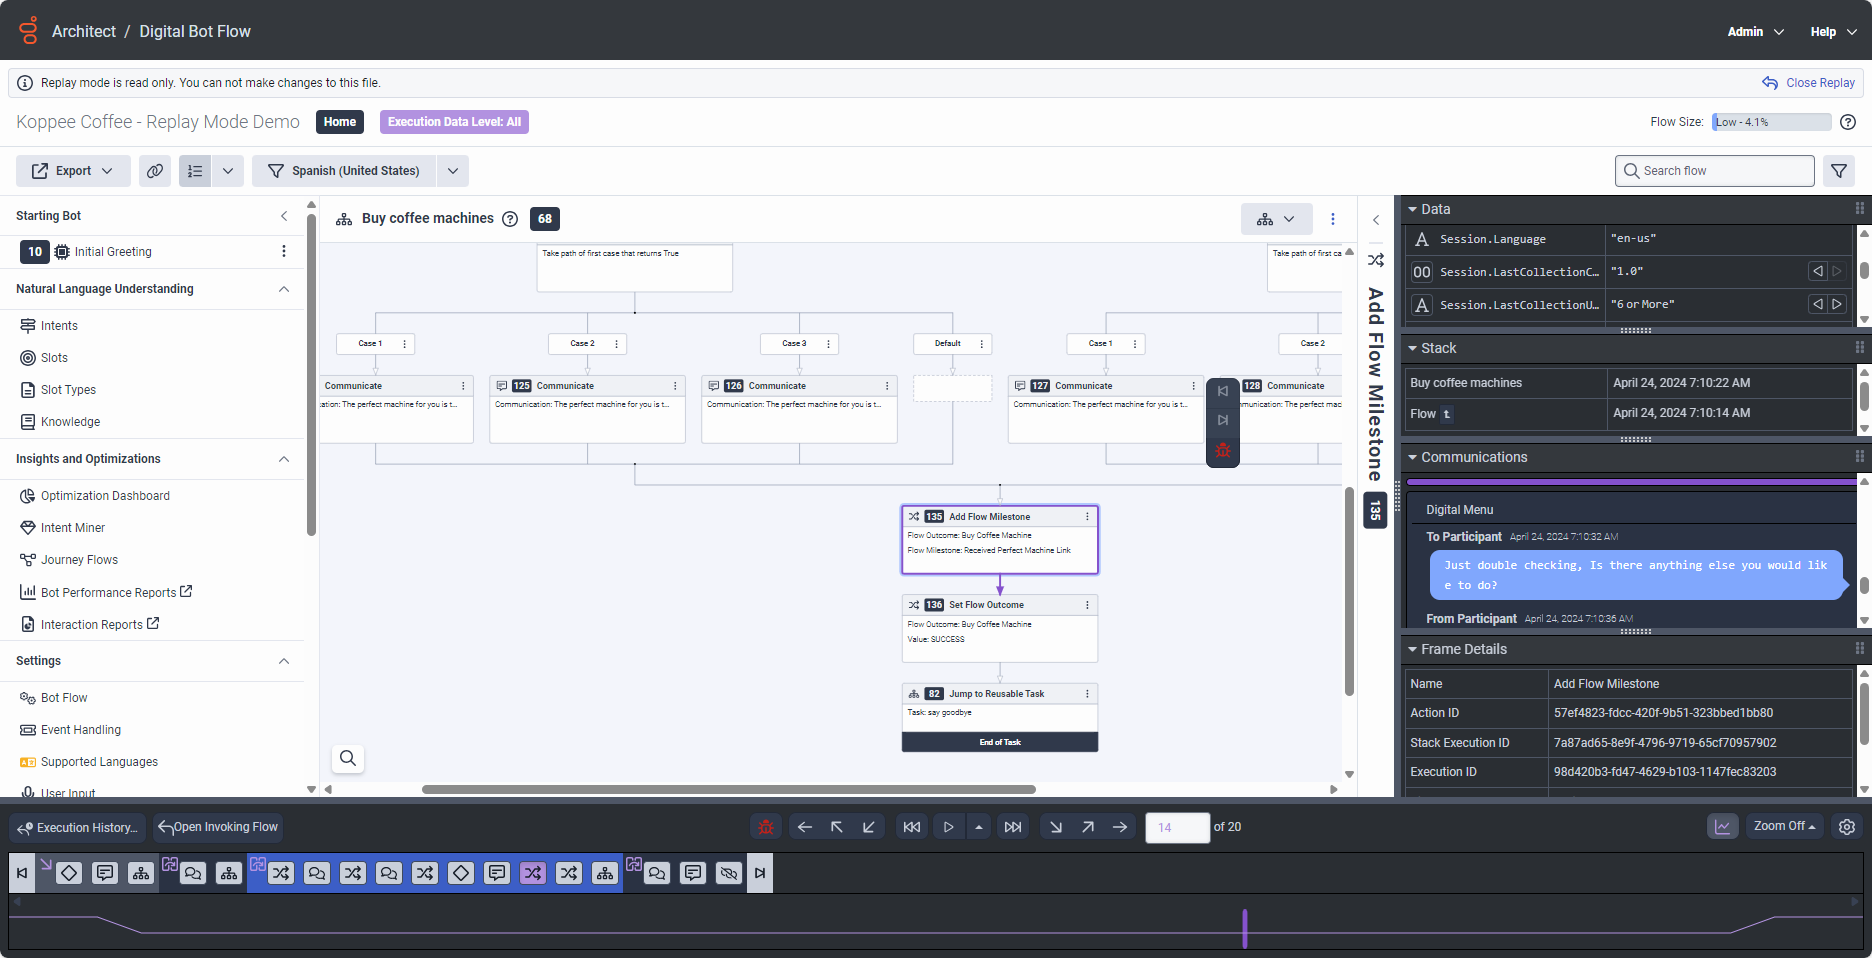
- Cliquez sur une instance de flux pour ouvrir l'instance en mode lecture. Pour plus d'informations, voir Utiliser le mode de relecture pour dépanner un flux d'architecture.
- Utilisez les commandes de relecture pour parcourir le flux et rejouer la séquence d'actions qui mène à l'élément de flux spécifique que vous souhaitez analyser.
- Si le niveau requis de données d'exécution est disponible, examinez les échanges de communication et inspectez également les valeurs des variables afin de localiser le problème avec le composant de flux.
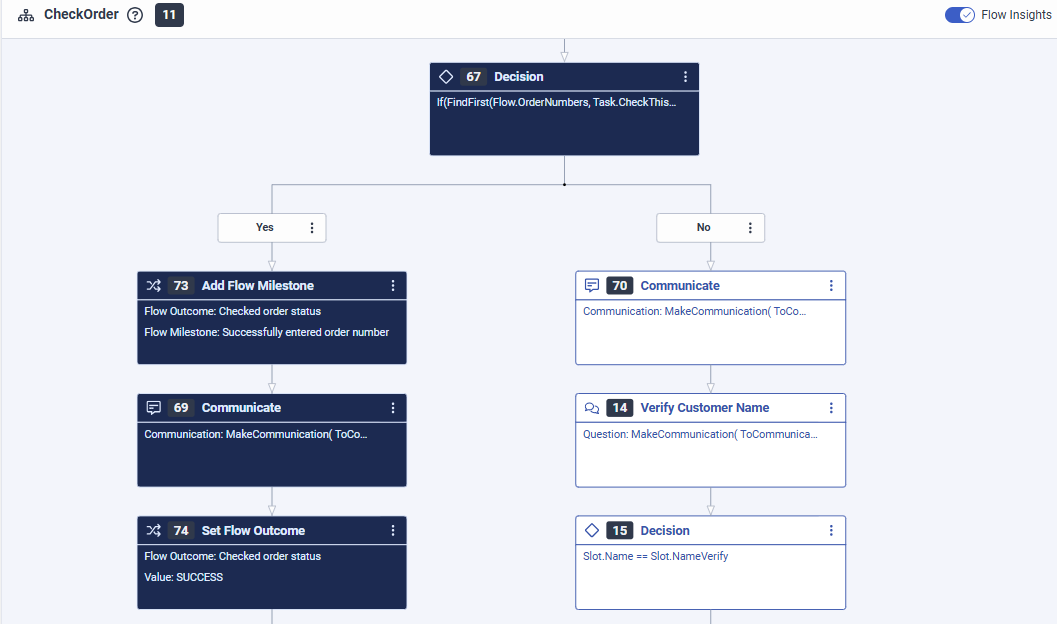
Dans l'exemple de flux de robots numériques suivant, les clients saisissent leur numéro de commande pour vérifier l'état de leur commande, mais le robot ne reconnaît pas le numéro.
- Le concepteur de flux a utilisé une action Ask for Slot pour vérifier le numéro de commande et a utilisé un slot de type
builtin:anypour stocker les données du client. - Une fois que le robot a reçu l'entrée, le flux passe à une action de décision qui utilise l'expression
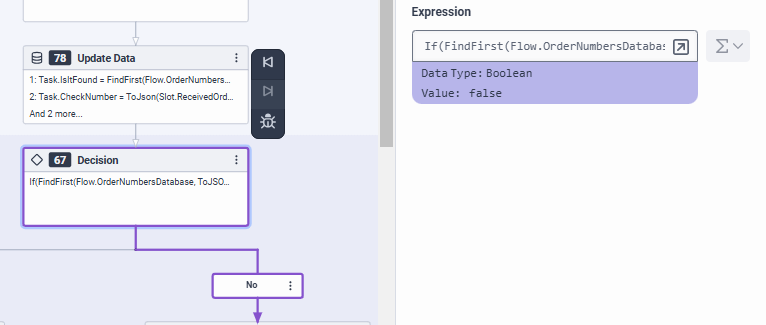
If(FindFirst(Flow.OrderNumbersDatabase, ToJSON(Task.CheckNumber))==-1, false, true)pour déterminer si le tableau des numéros de commande existants stockés dans la variableFlow.OrderNumbersDatabasecontient le numéro de commande saisi par le client (Task.CheckThisNumber).
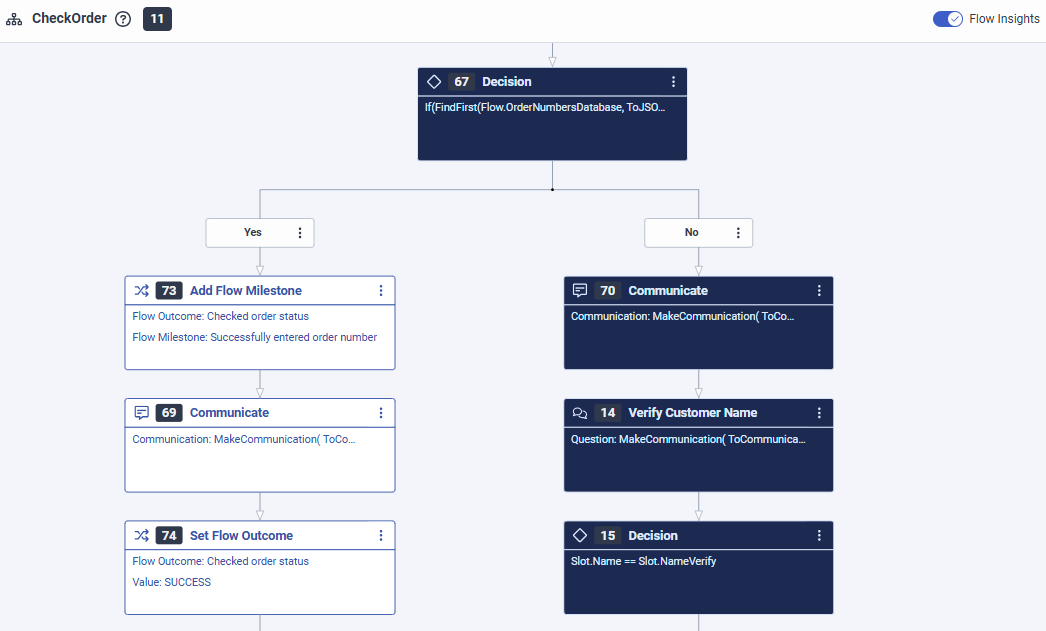
L'analyse de la carte thermique de Flow Insight montre que l'action Decision prend toujours le chemin malheureux :
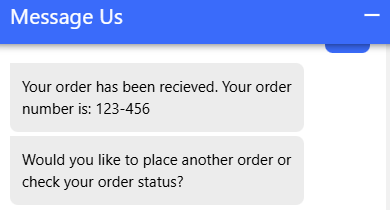
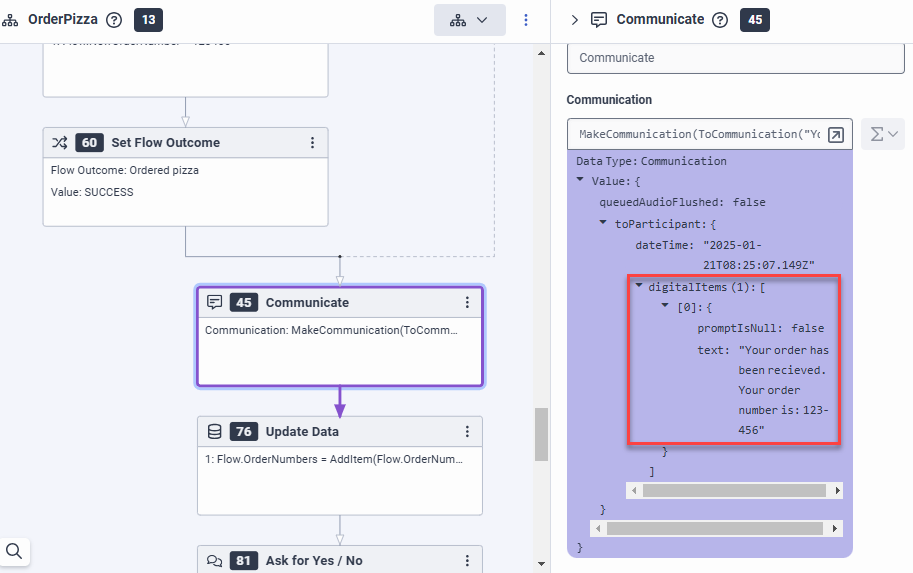
Le mode Replay de l'architecte permet de comprendre pourquoi cela se produit. Le robot utilise un modèle au format ###-### pour afficher le numéro de commande des clients, où chaque # représente un chiffre (0-9) et - un séparateur de tirets. Le format groupé est un modèle familier pour les clients, qui réduit la probabilité d'erreurs par rapport à une longue chaîne de chiffres, et facilite la lecture et la mémorisation du numéro.
Le problème de reconnaissance est dû au fait que le robot fournit le numéro de commande au format###-###, mais qu'il s'attend à ce que l'utilisateur saisisse une chaîne de chiffres sans tirets (voir les numéros de commande dans la variable Flow.OrderNumbersDatabase ). Cette inadéquation dans la conception du flux conduit à un échec de la reconnaissance.
Le mode lecture a révélé que le robot devait gérer les tirets dans les entrées des clients. Pour résoudre le problème de reconnaissance, utilisez un type de slot regex avec le motif ^\d{6}$|^\d{3}-\d{3}$ pour valider le format d'entrée et supprimer les tirets avant de comparer le numéro de commande à la base de données des commandes.
Obtenez des informations puissantes sur vos parcours clients avec Journey Management:
Les principaux avantages en un coup d'œil
Détail des principaux cas d'utilisation
Des informations exploitables
Supposez que vous êtes un analyste de centre de contact qui évalue l'efficacité des bots conçus pour les applications de médias sociaux. Votre objectif est de comparer le nombre de clients qui parviennent à une résolution grâce à des bots par rapport à des agents humains (ACD). Pour accomplir cette tâche, utilisez les fonctionnalités du Journey Analyzer.
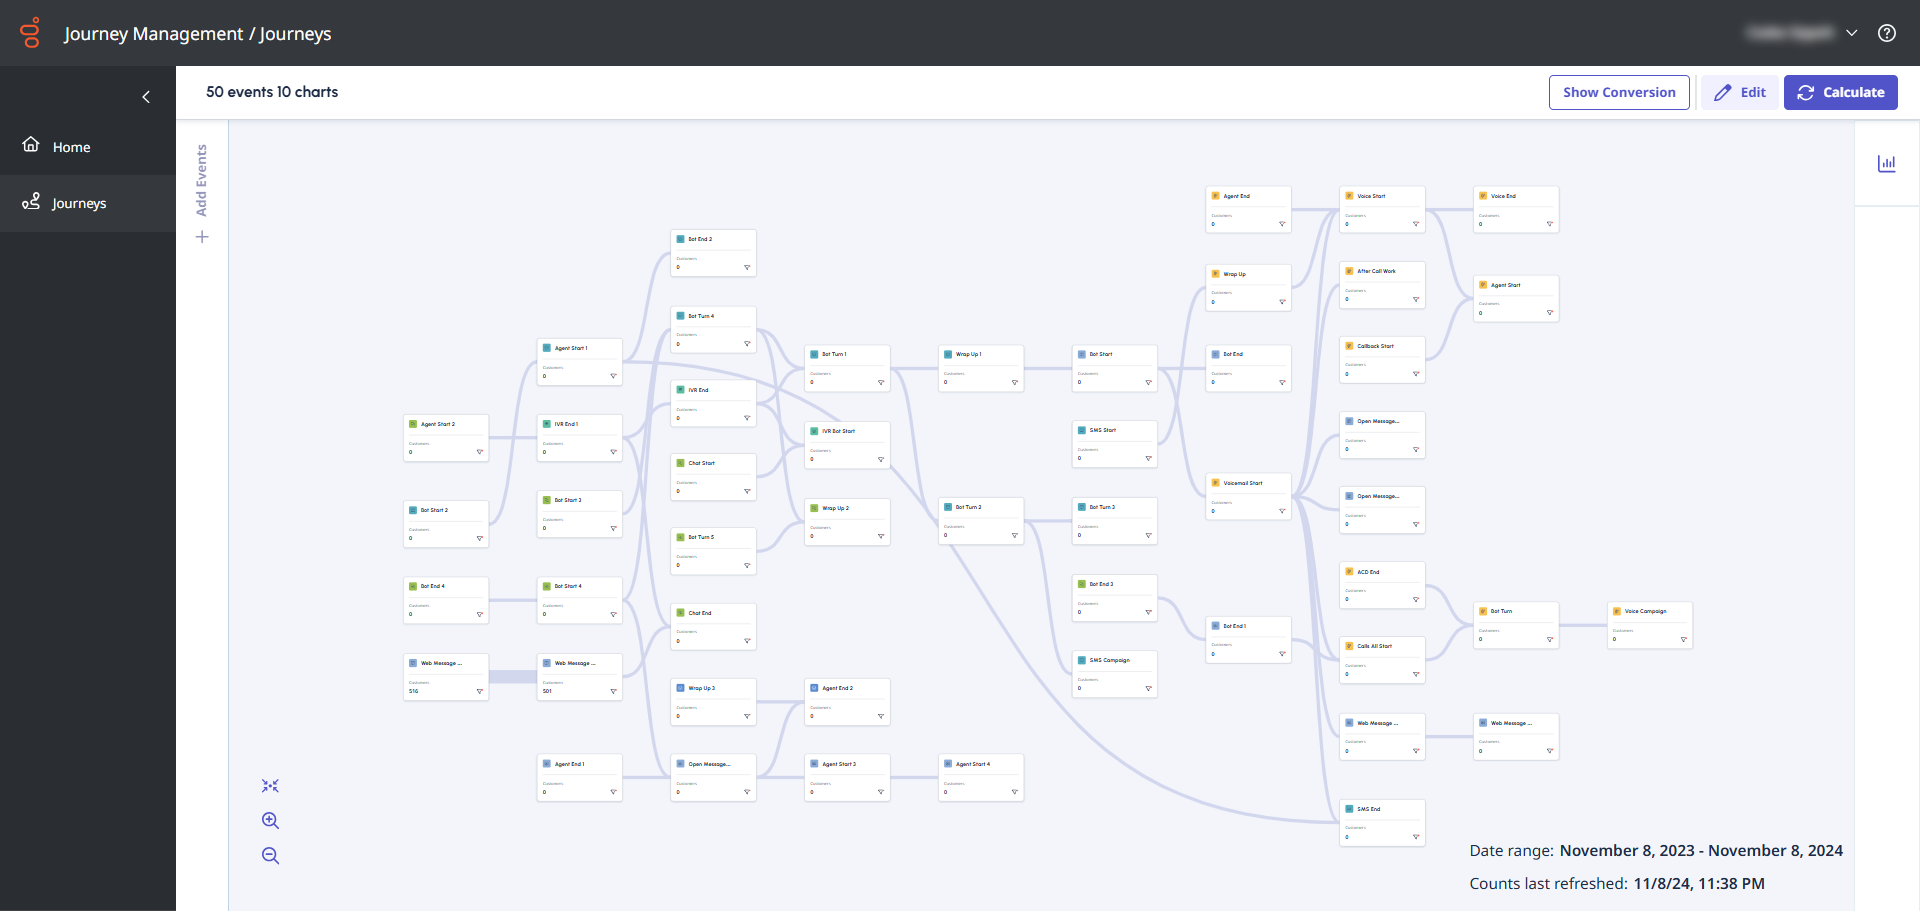
- Connectez-vous à votre compte Genesys Cloud et cliquez sur le menu Journey Management . L'écran Journey Management s'ouvre.
- Créer un nouveau voyage.
- Pour entrer dans le mode Edit et modifier un trajet, cliquez sur Edit.
- Les événements du parcours s'alignent sur les types d'actions qui sont déclenchées tout au long d'une interaction. L'événemente Customer Start est déclenché lorsqu'un client s'engage dans un canal. Faites glisser un événement Customer Start et filtrez-le pour le canal social que vous souhaitez mesurer.
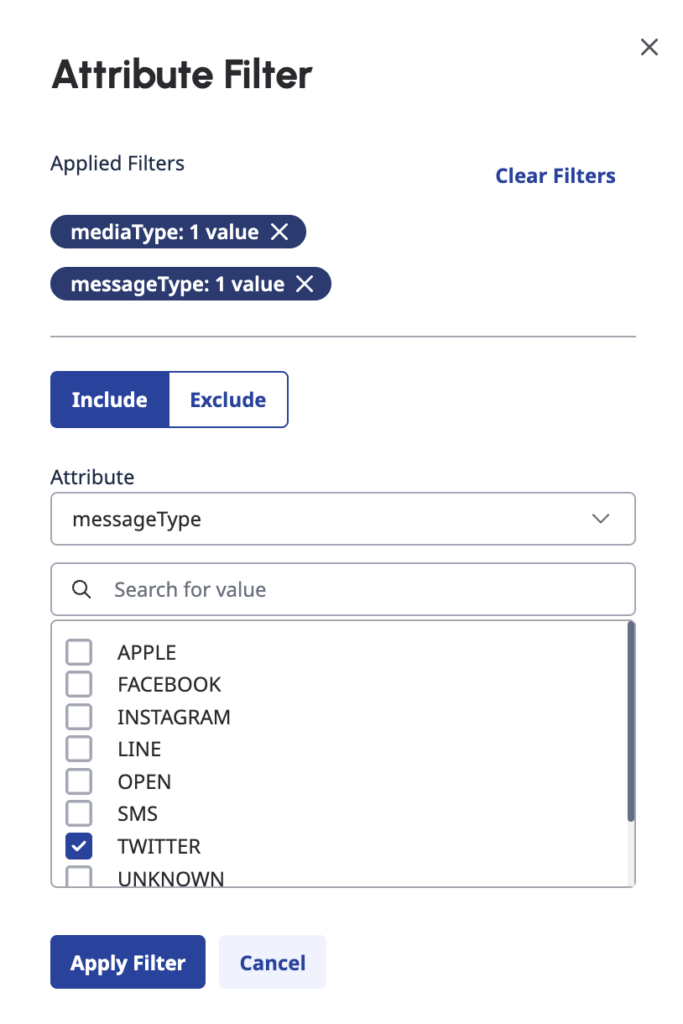
- Ouvrez l'événement, cliquez sur l'icône de filtre et sélectionnez ce qui suit :
- MediaType - Message
- MessageType - Les canaux sociaux que vous souhaitez mesurer
- Ajoutez un nom descriptif sur le canevas à cet événement, par exemple : A lancé un engagement socialnt sur Twitter.
- Ensuite, parce que vous voulez savoir combien de clients sont allés sur Bot Start après avoir commencé leur engagement social, faites glisser et déposez Bot Start sur le canevas et laissez-le se connecter à Customer Start.Conseil: Utilisez la touche Tabulation du clavier pour vous déplacer dans la liste des événements et utiliser le menu.
- Pour limiter l'événement au nom du robot, incluez le nom du robot dans le filtre de l'attribut de l'événement .
Conseil: Vous pouvez trouver le nom du bot dans Architect. La gestion des parcours prend en charge les événements des robots natifs ou tiers, mais les robots natifs fournissent des données plus détaillées sur le parcours.
- Pour limiter l'événement au nom du robot, incluez le nom du robot dans le filtre de l'attribut de l'événement .
- Maintenant, pour examiner les sessions de bot terminées, faites glisser Bot End sur le canevas et laissez-le se connecter à Bot Start.
- Comme vous vous intéressez au même robot que celui que vous avez examiné à l'étape 6, incluez l'identifiant du robot dans le filtre d'attribut d'événement de cet événement.
Conseil: Si vous utilisez un robot Genesys natif, pour limiter votre analyse à une intention et à d'autres attributs d'interaction susceptibles d'être pertinents, ajoutez Bot Turn entre le début et la fin. - Pour voir les sessions de robots terminées, incluez le filtre botsessionOutcome et sélectionnez ensuite l'attribut complete.
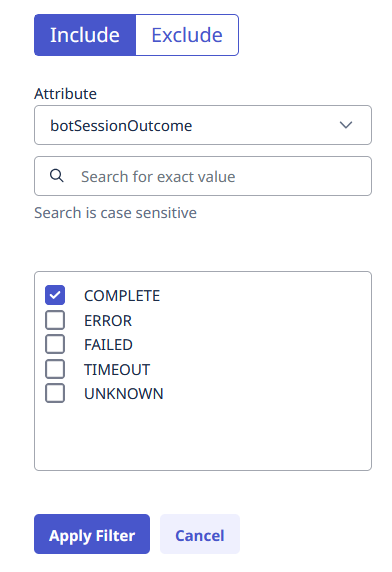
- Cliquez sur Appliquer le filtre.
- Comme dans cet événement, vous examinez les sessions de robots terminées et non les sessions qui sont allées à l'ACD (distribution automatique des appels), ajoutez un filtre BotResult dans la section Exclude avec TransfertoACD comme valeur.
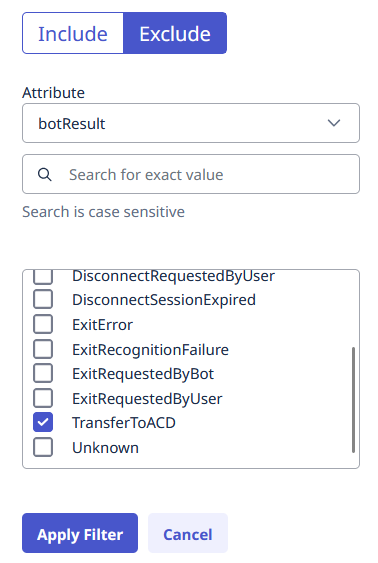
- Cliquez sur Appliquer le filtre.
- Comme vous vous intéressez au même robot que celui que vous avez examiné à l'étape 6, incluez l'identifiant du robot dans le filtre d'attribut d'événement de cet événement.
- Examinez ensuite les sessions qui ont été envoyées à l'ACD. Faites glisserl'événement ACD Start sur le canevas. Laissez-le se connecter à Bot Start, de manière à ce qu'il soit parallèle à Bot End.
- Dans cet événement, sélectionnez queueID comme Attribut, puis ajoutez un filtre pour Payment Queue.
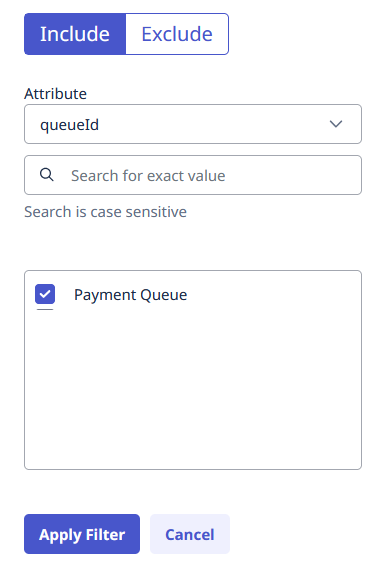
- Cliquez sur Sauvegarder.
Calculer et modifier le trajet de l'échantillon
- Cliquez sur Calculer pour générer des trajets. Une notification concernant le nombre de calculs s'affiche.
- Pour continuer, cliquez sur Procédez. Le calcul prend quelques minutes. Le temps de chargement dépend du volume de données à traiter, de sorte que les ensembles de données plus importants prennent plus de temps à calculer. Pour voir les résultats, rafraîchissez la page.
- Une fois le calcul terminé, vous souhaitez connaître le nombre d'appels résolus par les agents. Pour modifier le trajet, cliquez sur Edit.
- Faites glisser l'événement Agent Start et laissez-le se connecter à l'événement ACD Start.
- Ajouter un filtre pour la file d'attente de paiement . La file d'attente des paiements comporte deux codes de récapitulation : Succès et Échec.
- Suivre la résolution de l'agent avec un code de synthèse de la réussite. Dans le groupe d'événements Voice, faites glisser un événement Wrap Up sur le canevas et laissez-le se connecter à l'événement Agent Start . Sélectionnez l'attribut wrapupCode et incluez l'identifiant du code wrap-up Success comme filtre.
Note: Yous pouvez obtenir la liste des ID de code wrap-up utilisés dans votre environnement avec le point de terminaison Wrap-up API via API Explorer, qui est disponible sur le site Genesys Cloud Developer. - Pour indiquer qu'il s'agit du code de synthèse Success, ajoutez un titre descriptif à votre événement après appel, tel que "Successful Resolution".
- Suivre la résolution de l'agent avec un code de synthèse de la réussite. Dans le groupe d'événements Voice, faites glisser un événement Wrap Up sur le canevas et laissez-le se connecter à l'événement Agent Start . Sélectionnez l'attribut wrapupCode et incluez l'identifiant du code wrap-up Success comme filtre.
- Ajouter un filtre pour la file d'attente de paiement . La file d'attente des paiements comporte deux codes de récapitulation : Succès et Échec.
- Cliquez sur Sauvegarder.
- Pour mettre à jour le trajet, cliquez sur Calculer. Pour voir les comptes mis à jour, rafraîchissez la page.
Voir l'analyse de l'entonnoir dans l'exemple de parcours
With the help of funnel analysis, you can understand how your customers move through the journey to achieve their goals and then determine the success rates of their individual journey paths.
Un parcours doit comporter calculs pour l'analyse de l'entonnoir.
- Ouvrez le trajet existant que vous souhaitez analyser.
- En mode édition , cliquez sur Show conversion. Journey Analyzer calcule les indicateurs de conversion.
- Pour examiner les mesures attribuées, cliquez à nouveau sur l'icône + dans le coin supérieur droit de l'événement. Pour masquer les mesures de conversion d'un événement, cliquez sur l'icône - dans le coin supérieur droit.
- Pour déterminer le parcours de vos clients, examinez les indicateurs Clients, Taux de conversion, Abandonné out et Avancé lors des événements respectifs.
Exemple: L'analyse de l'entonnoir dans l'événement Bot Start montre que 650 clients ont abandonné le parcours à ce stade, et que 1052 clients ont avancé de à Bot end, de sorte que Bot end a un taux de conversion de 61,7 %. Cela signifie que 61,7 % de vos clients ont atteint la session Bot end.
- Renommez toujours les événements afin que le parcours soit lisible pour tout nouvel utilisateur et qu'il corresponde au scénario.
- Le Journey Management vous permet de tester vos propres hypothèses sur les parcours des utilisateurs. Par exemple :
- Vous pouvez modéliser un scénario pour tester que si les clients passent par le Bot A, leur taux d'escalade est-il plus élevé que celui des clients qui passent par le Bot B ? Vous pouvez faire glisser plusieurs événements Bot Start sur votre parcours et définir des filtres d'attributs pour Bot A et Bot B, respectivement.
- Vous pouvez examiner l'impact de la langue. Par exemple, mesurez si les clients qui s'adressent à un robot anglophone terminent les interactions avec autant de succès que les clients qui s'adressent à un robot francophone. Dans cette analyse, vous pouvez utiliser le filtre linguistique dans l'événement Bot Start.
- Vous pouvez travailler avec Journey Flows pour visualiser les schémas dans les flux et voir s'il y a des problèmes que vous voulez explorer. Par exemple, si vous observez des escalades, utilisez le Journey Analyzer pour comprendre la nature de l'escalade, la fréquence et le résultat.
Remarque : La gestion des parcours et les flux de parcours sont deux outils puissants qui peuvent se compléter, mais qui présentent plusieurs différences. Pour plus d'informations, voir Différences entre la gestion des itinéraires et les flux d'itinéraires. - Les vues de performance peuvent également vous aider à étayer vos analyses, comme Flow outcomes dans Architect, la vue Queues Performance view, ou la vue Interactions view dans Workspace.
- Le site AppFoundry propose plusieurs modèles que vous pouvez utiliser pour commencer.

